
Statistics for Data Science (III)
In this blog, I am going to summarize linear regression.
- A regression analysis is used to model the relationship between a dependent variable and one or more independent variables.
- independent variables are also called
explanatory variables,covariates,predictors. - The most common regression is linear regression.
R functions related to linear regression
- t.test(), can be used to analyze only two samples
# test whether the means of category 1 and category 2 are equal
t.test(category_1_data, category_2_data, var.equal=T)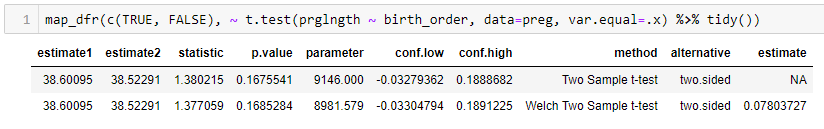
- aov(), ANOVA test, can be used to analyze two or more samples.
# test whether the mean values are equal
# if there is only one independent_variable and only two groups in this independent_variable,
# this ANOVA test is the same as t-test
summary(aov(dependent_variable ~ independent_variables, data = sample_data))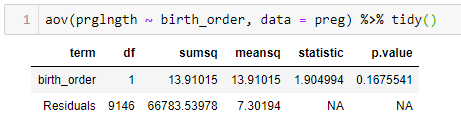
- lm(), can be used to analyze two or more samples
# test whether the means are equal
lm(dependent_variable ~ independent_variables, data=sample_data)
# use broom::tidy() to tidy output from lm()
broom::tidy(lm(value~factor, data=sample_data))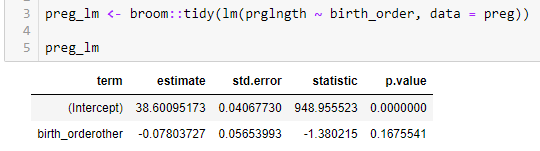
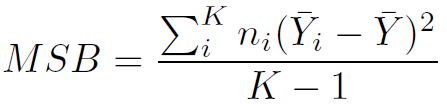
ANOVA explained
- MSB: mean squares between
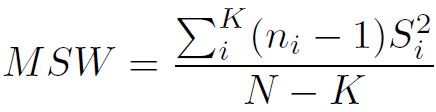
- MSW: mean squares within
- F statistic
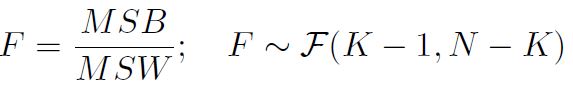
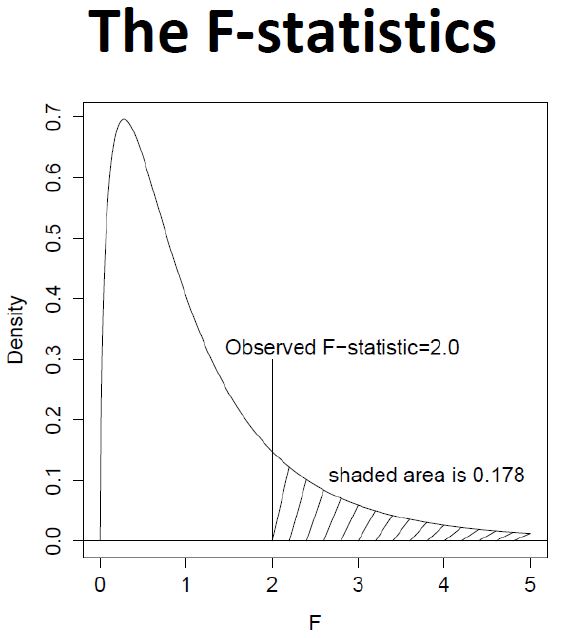
note: F statistic follows F distribution.
lm() explained
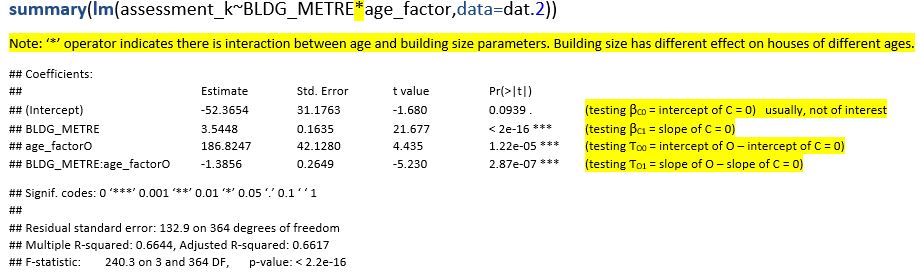
Suppose we want to model the relationship between house prices and house ages (two-level factor) and house sizes. We will consider the interaction between house ages and house sizes. A lm() function will generate a vector of parameters contains:
- age_factor_C # this is the intercept of C. also called ‘reference’
- age_factor_O # this is the change of intercept due to different age factor (O vs. C). also called ‘treatment effect’. it measures the difference in sample means
- size_C # this is the slope of size for C
- size_O # this is the change of slope due to different age factor (O vs. C)
Tests are always testing that the parameters (β0, β1, …) equal to zeros. Example:
When we do not consider the interaction between parameters, there will be only one slope. example:

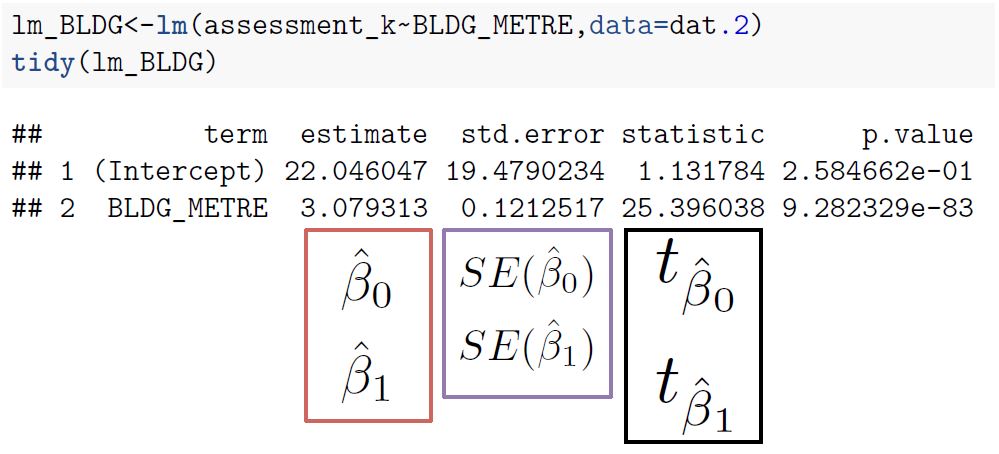
Use Linear Model in Estimation/Inference
A typical linear model looks like this:
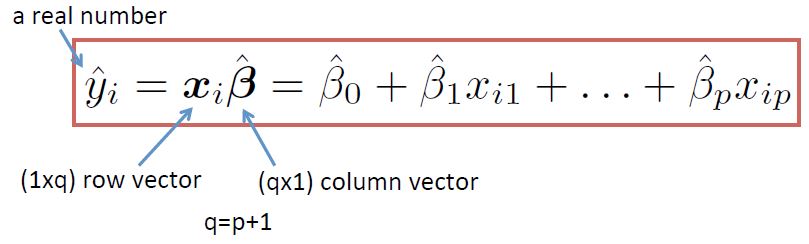
We use linear regression to estimate population parameters and also forecast y based on new x.
- confidence interval of intercept
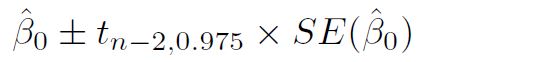
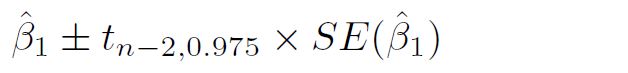
-
confidence interval of slope
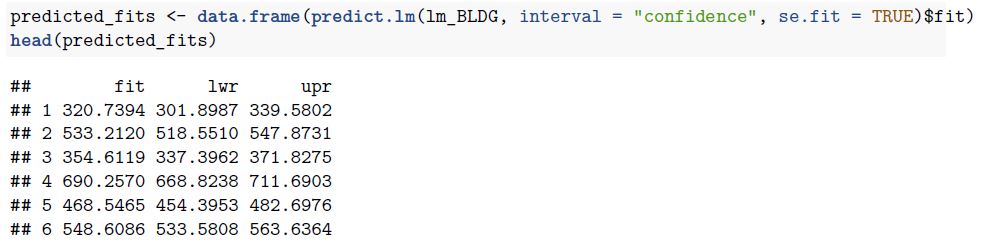
- Confidence interval of the prediction: the confidence interval for population mean
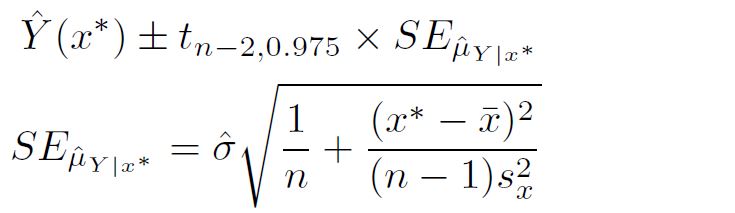
we can use lm() function to generate confidence interval of the prediction
- Prediction interval: the confidence interval for new point estimates

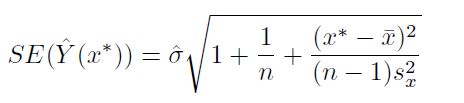
we can use lm() function to generate prediction intervals.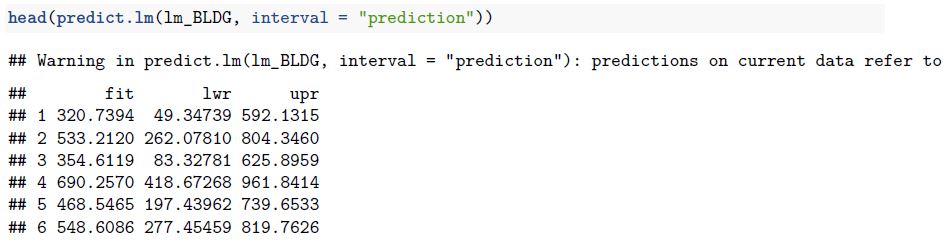
How to Measure the Goodness of Fit
One important measurement is the coefficient of determination
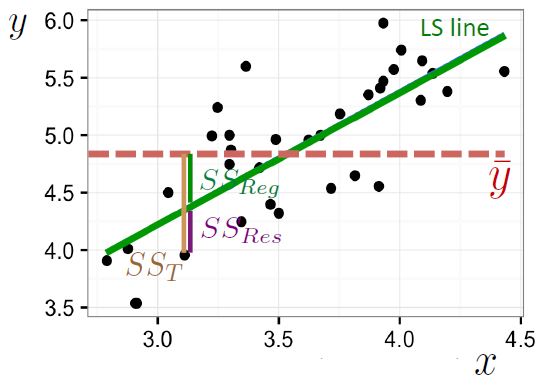
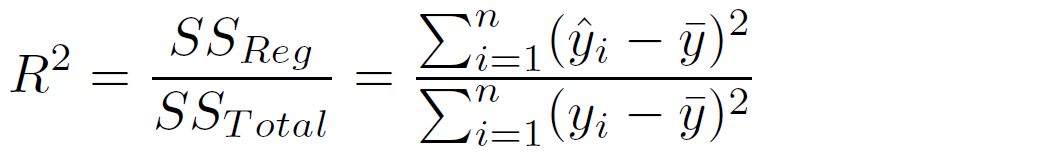
- in above equation, SS_Total stands for the sum of squared error of an intercept-only model.
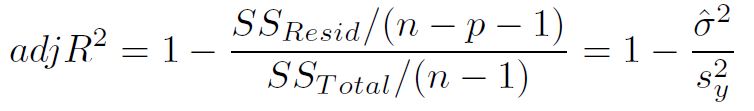
- because R^2 unnecessarily increases with additional explanatory variables, statistician created adjusted R^2, which takes into account the size of the model so that the index won’t be skewed due to additional explanatory variables.
Because R^2 does not have a known distribution so we can not use it to test the hypothesis that our full model is better than an intercept-only model. Statistician came out with a F-statistic.
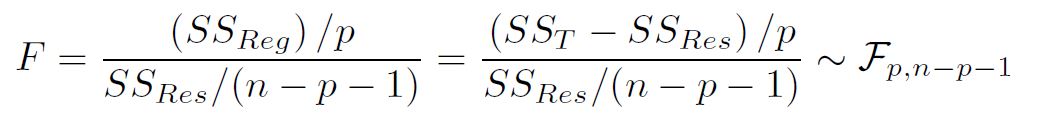
- with F-statistic, we can run F-test to test relevant hypothesis.